


IPFS News Link • Economy - Economics USA
Once again just perusing the latest updates from the St. Louis Fed…
• economicedge.blogspot.com
Monday, March 1, 2010
Economic Reality Check…
Once again just perusing the latest updates from the St. Louis Fed…
Many people get all wrapped around the axle about debt to GDP statistics. This is a complete Red Herring as comparing our Federal Government’s debt to the productivity of the nation is exactly the same as comparing your personal debt to the productivity of your neighborhood. They are unrelated.
What is completely related and totally relevant is DEBT to INCOME. In fact, in regards to debt, income is the only thing that really matters. Our Nation’s Income is crashing as shown in this chart expressed in year over year (yoy) change in Billions of dollars:

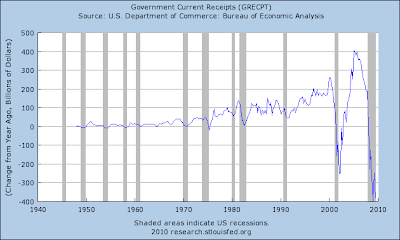
Our Current Government Receipts rose to approximately $2.5 Trillion and has collapsed to less than $2.2 Trillion, again expressed here in yoy change in Billions:
At the same time that our receipts are falling, our Federal Net Outlays are in an exponential growth phase, spiraling up in a now very out-of-control fashion. This is THE most important chart of the modern era! When this chart begins to roll over, and it will, it will mark the end of the last leg of support for our debt crippled economy:

The combination of rising outlays and falling receipts produces a negative Government Savings rate, clearly not sustainable but on an accelerating downward plummet into the depths of nation changing events that are right on the nearby horizon:

You are being told that the economy is improving, the only “improvement” is the amount being spent by the government. Take a look at the Consumption of Fixed Capital, one of the components of GNP:

Sales are up, REALLY? Below is a chart of Real Final Sales of Domestic Products yoy in Billions. Not only is it not positive, but it is still crashing:

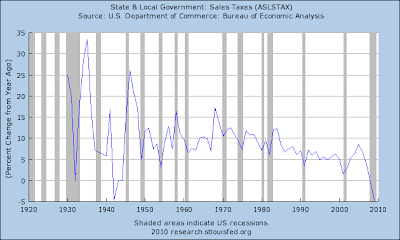
The tell in regards to sales is in the tax collected on sales. State and Local Government Sales Taxes are now down about 5% on a year over year basis:
Here’s the same chart expressed in yoy change in Billions of dollars – no change of path, not even a wiggle or a waiver:

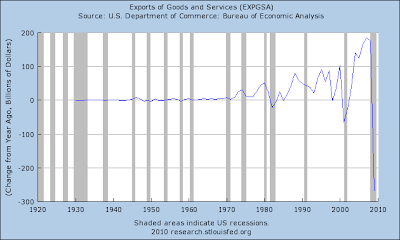
How about Imports and Exports? Aren’t we being told that they are increasing again? Absolutely not the case, again, nothing but collapse. Take a look at Exports of Goods and Services expressed in yoy change in Billions:
Now take a look at the yoy change in Real Imports of Goods and Services:

Historic collapse, take a look at the magnitude of the collapse and how far back those charts go in time. You can talk up the “recovery” all you want, you can call it a “recession” all you want, but lip service does not change what is occurring on those charts and to our debt saturated economy.
We let the Central Bankers take over our money supply and we let them back all our money with debt at their benefit and at our expense. It is time to change that equation around!
Please support Freedom’s Vision by registering for the Swarm, and bee sure to tell your friends. Do it for your country and do it for future generations.
Many people get all wrapped around the axle about debt to GDP statistics. This is a complete Red Herring as comparing our Federal Government’s debt to the productivity of the nation is exactly the same as comparing your personal debt to the productivity of your neighborhood. They are unrelated.
What is completely related and totally relevant is DEBT to INCOME. In fact, in regards to debt, income is the only thing that really matters. Our Nation’s Income is crashing as shown in this chart expressed in year over year (yoy) change in Billions of dollars:

Our Current Government Receipts rose to approximately $2.5 Trillion and has collapsed to less than $2.2 Trillion, again expressed here in yoy change in Billions:

At the same time that our receipts are falling, our Federal Net Outlays are in an exponential growth phase, spiraling up in a now very out-of-control fashion. This is THE most important chart of the modern era! When this chart begins to roll over, and it will, it will mark the end of the last leg of support for our debt crippled economy:

The combination of rising outlays and falling receipts produces a negative Government Savings rate, clearly not sustainable but on an accelerating downward plummet into the depths of nation changing events that are right on the nearby horizon:

You are being told that the economy is improving, the only “improvement” is the amount being spent by the government. Take a look at the Consumption of Fixed Capital, one of the components of GNP:

Sales are up, REALLY? Below is a chart of Real Final Sales of Domestic Products yoy in Billions. Not only is it not positive, but it is still crashing:

The tell in regards to sales is in the tax collected on sales. State and Local Government Sales Taxes are now down about 5% on a year over year basis:

Here’s the same chart expressed in yoy change in Billions of dollars – no change of path, not even a wiggle or a waiver:

How about Imports and Exports? Aren’t we being told that they are increasing again? Absolutely not the case, again, nothing but collapse. Take a look at Exports of Goods and Services expressed in yoy change in Billions:

Now take a look at the yoy change in Real Imports of Goods and Services:

Historic collapse, take a look at the magnitude of the collapse and how far back those charts go in time. You can talk up the “recovery” all you want, you can call it a “recession” all you want, but lip service does not change what is occurring on those charts and to our debt saturated economy.
We let the Central Bankers take over our money supply and we let them back all our money with debt at their benefit and at our expense. It is time to change that equation around!
Please support Freedom’s Vision by registering for the Swarm, and bee sure to tell your friends. Do it for your country and do it for future generations.


1 Comments in Response to Once again just perusing the latest updates from the St. Louis Fed…
A bottom-line thought about this...
"This is a complete Red Herring as comparing our Federal Government’s debt to the productivity of the nation is exactly the same as comparing your personal debt to the productivity of your neighborhood. They are unrelated.
"What is completely related and totally relevant is DEBT to INCOME. In fact, in regards to debt, income is the only thing that really matters."
With regard to the above article quote, legally the INCOME of the Government is completely different from the income of the people who have no INCOME agreement with Government. Since this article shows the complete mess the FED and Government have brought our nation to, a mess that cannot be reversed, let's get it over with. Stop telling the Government that you are liable for the INCOME TAX. Learn the truth and tell the truth, that your income is not the same as INCOME except when you tell them it is. Let's reduce their funding and get this thing over with so we can move on with out lives. See: http://www.losthorizons.com/index.html